
Classic Technical Analysis: A Complete Guide to Understanding Trends and Price Patterns
Traders use various methods to enter financial markets effectively. One of the most trusted approaches is classic technical analysis. This method involves identifying the market trend and then using trendlines and price patterns to predict future price behavior. In this article, we explain the complete process of classic technical analysis and introduce you to different types of trends, trendlines, price channels, and chart patterns.
Dow Theory
Modern technical analysis traces its roots back to the Dow Theory, developed by Charles H. Dow, one of the founders of Dow Jones & Company, Inc., alongside Edward Jones and Charles Bergstresser. The Dow Jones Industrial Average was created in 1896 by these pioneers. Dow formulated his theory through a series of articles published in the Wall Street Journal.
Dow believed that the stock market represents a measurable scale of the overall business conditions within the economy. By analyzing the market as a whole, investors can assess the current state accurately and identify the major trend direction of the market and individual stocks.
The six main principles of Dow Theory are:
- All information is reflected in the price.
- There are three primary trends in the market.
- Primary trends consist of three phases.
- Indexes must confirm each other.
- Volume confirms the trend.
- Trends persist until a clear reversal occurs.
The Importance of Trend Identification
The trend represents the direction of price movement in the market. Identifying the trend is crucial because it is generally recommended to trade in the direction of the trend. Technical analysts use trend identification to forecast future price behavior.
Types of Trends
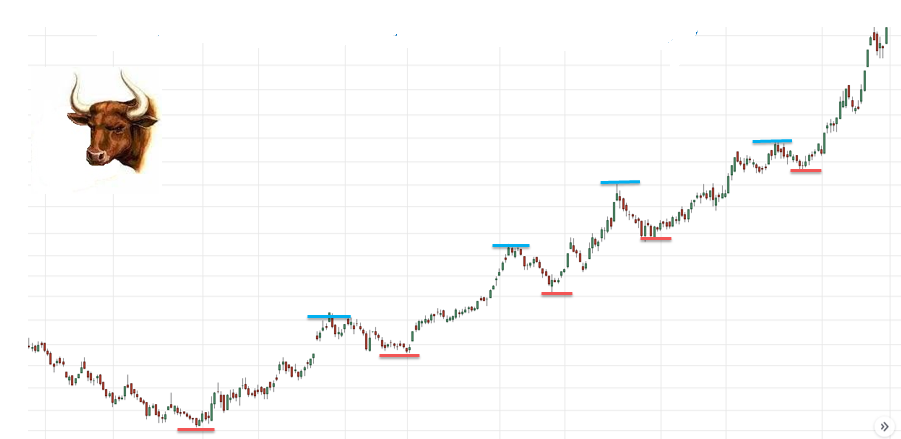
- Uptrend (Bullish): Each successive peak and trough is higher than the previous ones. This upward price movement is known as a bull market, inspired by how a bull attacks by thrusting its horns upward.
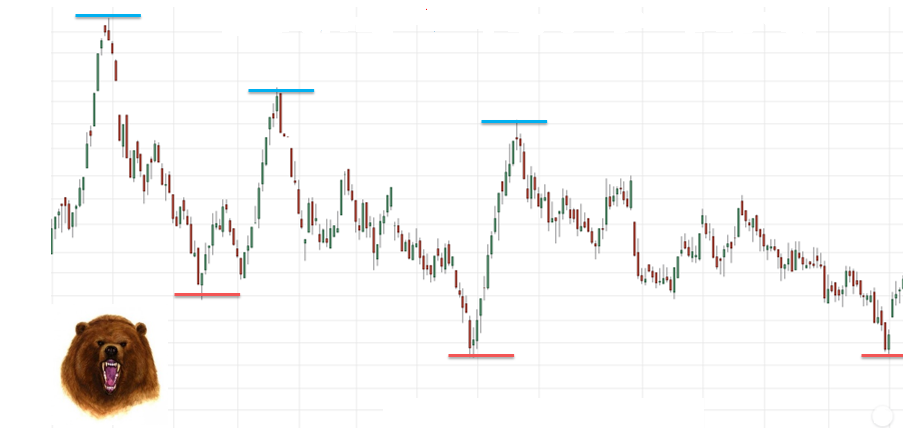
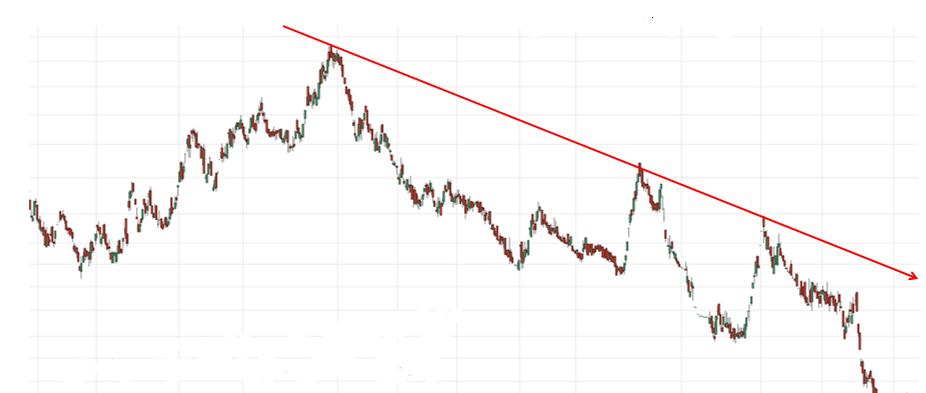
- Downtrend (Bearish): Each successive peak and trough is lower than the previous ones. This downward trend is called a bear market, named after how a bear swipes its paws downward.
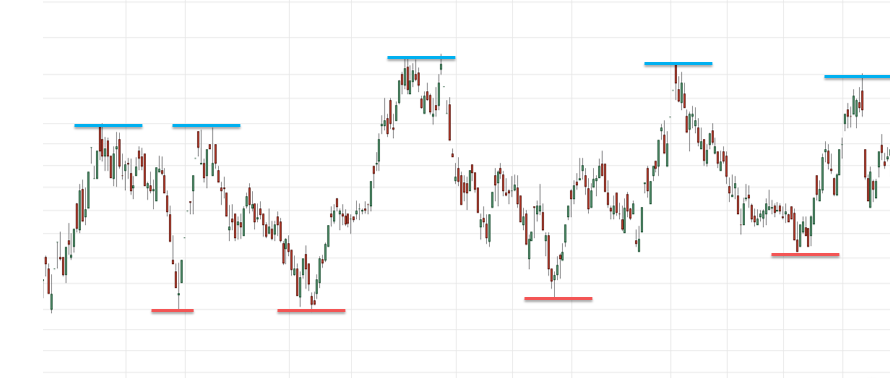
- Sideways Trend (Neutral): Price moves horizontally with no clear upward or downward direction.
Trendlines and Price Channels
Trendlines
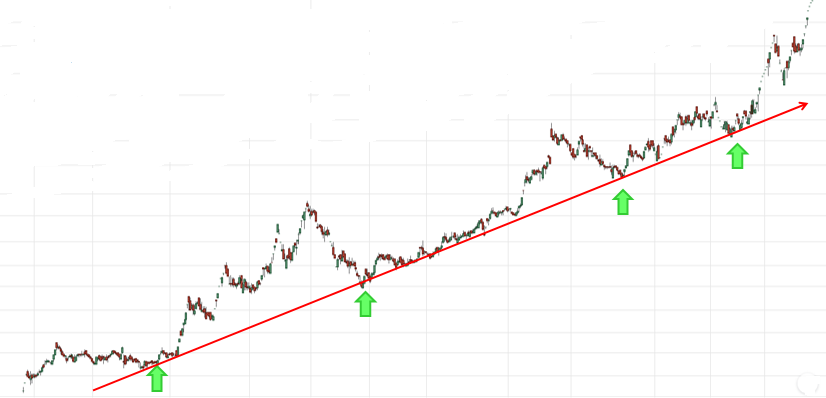
Trendlines are diagonal lines drawn on price charts by connecting successive peaks or troughs. They act as dynamic support or resistance levels.
- Uptrend Line: Drawn by connecting consecutive troughs in an uptrend; acts as support.
- Downtrend Line: Drawn by connecting consecutive peaks in a downtrend; acts as resistance.
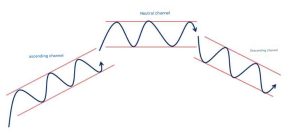
Price Channels
When price oscillates between two parallel trendlines, it forms a price channel. Channels can be upward, downward, or horizontal. Traders use channels to identify trading opportunities within the range.
Support and Resistance Zones
Identifying support and resistance levels helps traders anticipate price reversals or breakouts. These levels are categorized into static and dynamic:
- Static Levels: Price areas that have historically acted as support or resistance and may do so again.
- Dynamic Levels: Trendlines acting as moving support or resistance.
Classic Price Patterns
Price patterns can be divided into two categories:
1. Continuation Patterns
These represent a pause or correction within a trend before the previous trend resumes. Common continuation patterns include:
- Triangles: Formed by two converging trendlines.
- Flags: Small rectangles or parallelograms slanting against the trend.
- Wedges: Converging trendlines both slanting up or down.
- Rectangles: Horizontal channels showing consolidation.
2. Reversal Patterns
These appear at the end of a trend and signal a change in trend direction. Common reversal patterns include:
- Head and Shoulders
- Double Tops and Bottoms
- Triple Tops and Bottoms
Conclusion
Classic technical analysis is a widely used method among traders to enter and navigate financial markets. By understanding how to identify trends, draw trendlines, and recognize key price patterns, traders can make more informed decisions. For those interested in deepening their knowledge, our Hatrick Analysis School offers comprehensive courses covering these essential topics.
Frequently Asked Questions
What is Dow Theory?
Dow Theory states that the stock market reflects the overall business conditions of the economy, and by analyzing market trends, one can predict the direction of both the overall market and individual stocks.
Why is an uptrend called a “bull market”?
An uptrend is called a bull market because it reflects how a bull attacks, thrusting its horns upward, symbolizing rising prices driven by buyers.
Why is a downtrend called a “bear market”?
A downtrend is called a bear market because it reflects how a bear attacks, swiping its paws downward, symbolizing falling prices caused by sellers.