
📘 Al Brooks Price Action – Part 2/2
Advanced Price Action Analysis, Setups, and Multi-Timeframe Context
—
🔄 Trend Reversals
Understanding how trends reverse is key to catching profitable moves before they become obvious. According to Al Brooks, trend reversals usually begin with one of the following:
Double tops/bottoms
Wedges (3-push patterns)
Trendline breaks followed by lower highs or higher lows
Climactic exhaustion moves
🔍 Example:
A market in a strong uptrend creates a double top near resistance. The second high has a weaker bull candle and is followed by a strong bear reversal bar. A trendline break confirms the setup. This is a classic Al Brooks reversal signal.
—
🚀 Strong Trends
Strong trends have minimal pullbacks and continuous pressure in one direction. Characteristics include:
Repeated large trend bars in one direction
Gaps between bars or breakouts with follow-through
Few or no meaningful pullbacks
🛠 Strategy:
In strong trends, don’t fade the move. Wait for minor pullbacks to enter in the trend’s direction using smaller timeframes to time your entries.
—
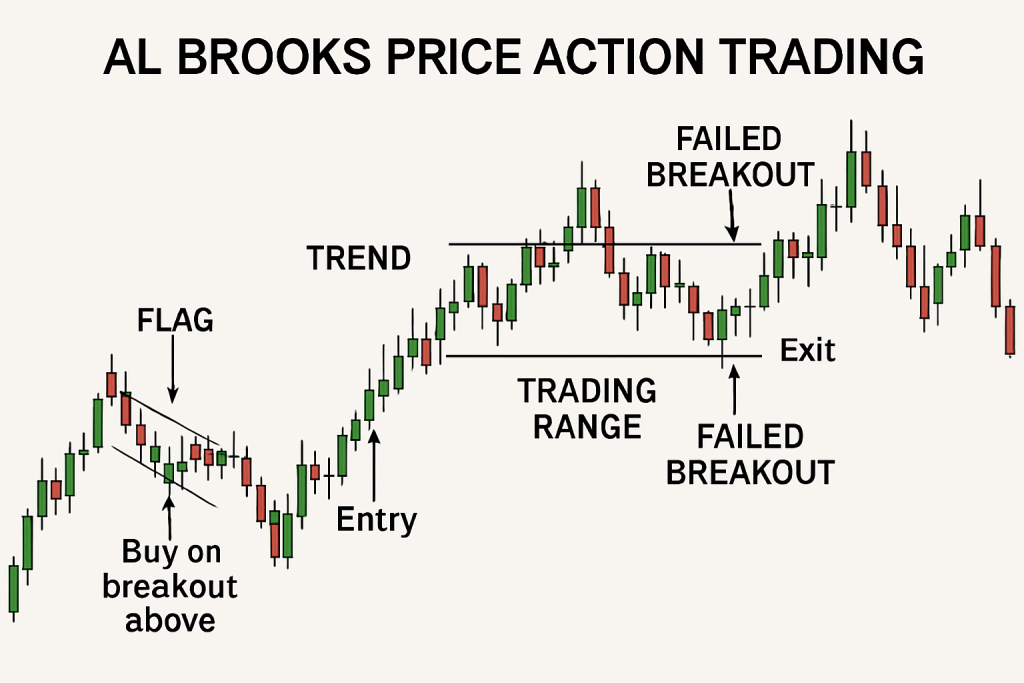
⚑ Flags (Continuation Patterns)
Flags are consolidation patterns within a trend, often forming:
Bull flags in uptrends
Bear flags in downtrends
These usually look like tight ranges or channel pullbacks. Once they break in the trend’s direction, continuation is expected.
🔍 Example:
After a strong bull trend, price forms a small downward channel (a bull flag). A breakout above the flag’s upper trendline with a strong bull bar is an entry signal for continuation.
—
🔼 Ascending and Descending Wedges (Converging Patterns)
These are reversal or continuation patterns formed by converging trendlines:
Ascending wedge: Often reverses uptrends
Descending wedge: Often reverses downtrends
Brooks emphasizes watching for three pushes to confirm a wedge.
—
🔺 Triangle and Rectangle Patterns
🔼 Triangle:
Formed by converging trendlines (symmetrical or asymmetrical).
Signal consolidation, often before a breakout.
▭ Rectangle:
A horizontal trading range with equal highs and lows.
Could break in either direction; watch for breakout bars and follow-through.
—
📈 Channels
Channels are defined by a trendline and a parallel line on the opposite side of price action. There are two types:
Tight channels: Clean trends with minimal pullbacks.
Broad channels: Trends with overlapping bars and frequent deep pullbacks.
—
🪄 Channel and Trendline Duel
Sometimes, two trendlines form a “duel”—one acting as a tighter inner channel, the other a broader outer trendline. Brooks shows that when the inner line breaks, price often heads toward the outer trendline.
—
📊 Analyzing Price Legs
A leg is a directional move. Al Brooks suggests counting legs:
Most pullbacks have 2 legs.
Complex corrections have 3 or more.
Example:
An uptrend pulls back with one bear leg, a pause, and then another bear leg. The second leg often marks the end of the correction — a signal to look for longs.
—
🌀 Channel Conditions: Strong, Weak, and Transitioning
Brooks classifies channels into three states:
1. Strong trends: Minimal pullbacks
2. Weak trends: Pullbacks overlap, many doji candles
3. Transitioning: Signs of reversal, including failed breakouts
Recognizing these transitions is crucial to avoid chasing trends late or fading too early.
—
📏 Trading Ranges (Sideways Markets)
Trading ranges dominate markets more than trends. They consist of horizontal price movement, with clear support and resistance.
Tips:
Fade moves near the edges of the range.
Avoid breakout entries unless there is strong momentum and follow-through.
—
🔁 FTR – Failure to Return
An FTR is a zone where price fails to return after a breakout or a strong rejection. It creates high-probability zones where price is likely to react again.
Example:
Price rejects a resistance level and collapses. It returns later, touches the same level but shows rejection again. That zone is an FTR and becomes a supply zone.
—
📉 Big Up – M Pattern – Big Down
Brooks explains how a bullish surge (Big Up) can be followed by an M pattern and then a strong bearish move (Big Down). The M formation is often subtle but shows up as:
A higher high with a bearish reversal bar
A lower high confirming the second top
Breakdown below the middle of the M
This signals a reversal of sentiment and momentum.
—
⏪ Reversal Trading Ranges
Some ranges form at the end of a trend, not as continuation. These act as reversal bases where price accumulates orders before flipping direction.
—
🌐 Multi-Timeframe Supply & Demand Zones
Brooks emphasizes aligning zones across multiple timeframes. For example:
If H1 and H4 both show resistance at the same level, it becomes stronger.
A setup on M15 that aligns with a higher timeframe zone has higher probability.
—
🔁 Pullbacks
Pullbacks are temporary movements against the prevailing trend. Brooks stresses the importance of pullback structure:
2-leg pullbacks are common.
Entry is usually taken on the end of the second leg, especially if it ends with a strong signal bar.
—
🟢 EMA Pullbacks
When price pulls back to the 20-EMA, it often finds support/resistance there. Brooks highlights:
EMA = dynamic S/R in trends.
Look for reversal signal bars at the EMA.
More reliable in tight channels.
—
🧲 Magnet Areas
A magnet is a price level that repeatedly pulls price toward it. It could be:
A previous high/low
Midpoint of a range
A major moving average
—
📤 Breakout Spike
A spike is a sudden surge in price with momentum. After a spike, price usually forms a channel.
Brooks calls this the spike and channel trend:
1. Spike = breakout
2. Channel = grind in the same direction
—
🧬 Micro Channels
Very tight trends with small candles and no meaningful pullbacks. These are hard to trade but very bullish or bearish depending on direction.
—
🔁 MTR – Major Trend Reversal
Brooks’ Major Trend Reversal setup includes:
A strong trend
Loss of momentum
Double top/bottom or wedge
A strong signal bar in the new direction
This is one of the most powerful reversal patterns in Al Brooks’ method.
—
🏆 Al Brooks’ Top 10 Setups
1. Second entries
2. Wedge reversals
3. Failed breakouts of ranges
4. Pullbacks to EMA with signal bar
5. Micro double tops/bottoms
6. Trendline breaks with retests
7. Strong signal bars at S/R
8. Failed second entries
9. Reversals off prior highs/lows
10. Spike and channel ends
These setups are core to Al Brooks’ strategy and represent high-probability opportunities when traded with proper context.
—
🧠 Final Thoughts
Al Brooks’ Price Action methodology is dense but rewarding. It focuses on reading price like a story, candle by candle. Mastery takes time, but applying these principles with discipline offers clarity in even the most chaotic markets.