
📘 Al Brooks Price Action Trading: Complete Guide (Part 1 of 2)
Introduction
Price action is the language of the market — raw, unfiltered, and filled with meaning. While many traders rely on indicators, Al Brooks teaches that reading pure price movement offers the clearest window into market behavior. His approach, based on candlestick interpretation, structure, and context, has empowered thousands of traders to decode the charts and gain an edge.
In this first part of our deep-dive guide, we cover the fundamental concepts of Al Brooks’ methodology — from understanding the market’s truths to recognizing powerful price structures and trade signals.
—
🔍 The Truth of the Market
Before learning patterns and setups, Al Brooks emphasizes a core truth:
> Every price movement is a result of the balance between buyers and sellers.
There are no hidden forces. If price is going up, it means buyers are aggressive. If it’s falling, sellers dominate. Indicators are lagging and often misleading. Price itself is the only real-time data.
Key Takeaway:
Don’t ask why the market moves. Focus on what the market is doing now.
—
📈 Price Movement and Supply & Demand
Price moves because of changes in supply and demand. But rather than measuring volume or news, Brooks teaches to observe price bars:
Strong Bullish Bars: Suggest buying pressure
Strong Bearish Bars: Indicate selling pressure
Tight Ranges: Suggest balance or indecision
Example:
If you see three consecutive strong bullish bars with small wicks, it’s likely a bull spike, suggesting aggressive demand and continuation.
—
📊 What Is Price Action?
Price action is the interpretation of price movement without relying on indicators.
Al Brooks reads:
Candles (size, body vs. wick, close relative to range)
Context (what happened before and where we are now)
Patterns (flags, trends, breakouts, trading ranges)
This approach allows traders to:
Anticipate market behavior
Spot high-probability trade setups
Understand market psychology
—
🔁 Cycles on the Chart
Markets rotate between three core phases:
1. Trend: Price moves in one dominant direction.
2. Pullback: Temporary correction against the trend.
3. Trading Range: Sideways movement between support and resistance.
Brooks teaches to identify the transition between phases — this is where high-probability trades often occur.
Example:
If a strong trend is followed by smaller bars and loss of momentum, a trading range may be forming.
—
🕯 Candlestick Basics (Brooks Interpretation)
Al Brooks does not treat candlesticks as standalone signals. Instead, he focuses on:
Body size: Larger body = strength
Closes: Close near high (bullish), near low (bearish)
Wicks: Indecision or rejection
Relative bar position: Inside bars, outside bars, do they break highs or lows?
—
⚡ Pin Bar and Engulfing Patterns
While many traders use pin bars and engulfing candles as reversal signals, Brooks interprets them in context.
Pin Bar:
A bar with a small body and long wick (tail).
On its own = weak. In the right context (at resistance in a trend) = stronger.
Engulfing Bar:
A bar that fully engulfs the prior candle.
Strong when it occurs at the end of a pullback.
Never trade a pattern without context.
—
✅ Signal Bars
A signal bar is the bar that suggests an entry on the next candle.
Features of a Good Signal Bar:
Strong body in the desired direction
Closes near the high (for buys) or low (for sells)
Minimal wicks on the opposite side
Appears in the right location (e.g., support, trendline)
Example: In an uptrend pullback, a bullish signal bar with a strong close might signal resumption.
—
📉 Support and Resistance
Brooks teaches that support and resistance are not fixed lines but zones created by:
Prior swing highs/lows
Closes of strong candles
Breakout points
Trading range boundaries
Key insight:
> Support and resistance are areas where traders previously disagreed. They often become battlegrounds again.
—
📈 Trends
A trend is defined by:
Series of higher highs and higher lows (uptrend)
Series of lower highs and lower lows (downtrend)
But Brooks goes deeper:
Strong trends have minimal pullbacks
Weak trends pause often, have overlapping bars
He classifies trends as:
Spike and Channel
Stair-step
Broad Channel
—
🔁 Trend Reversals
Reversals often begin subtly:
Tight ranges
Failed breakouts
Double tops or bottoms
Loss of momentum
Brooks emphasizes:
> Most reversals fail. Don’t trade every reversal — wait for confirmation or signs of transition (e.g., lower high after a top).
Example:
In an uptrend, a second push up with less strength = possible double top reversal.
—
💪 Strong Trends
Strong trends are characterized by:
Consecutive large bars
Small or no tails
Gaps between bars
Breakouts holding without pullback
In strong trends, don’t fade — join the move or stay out.
—
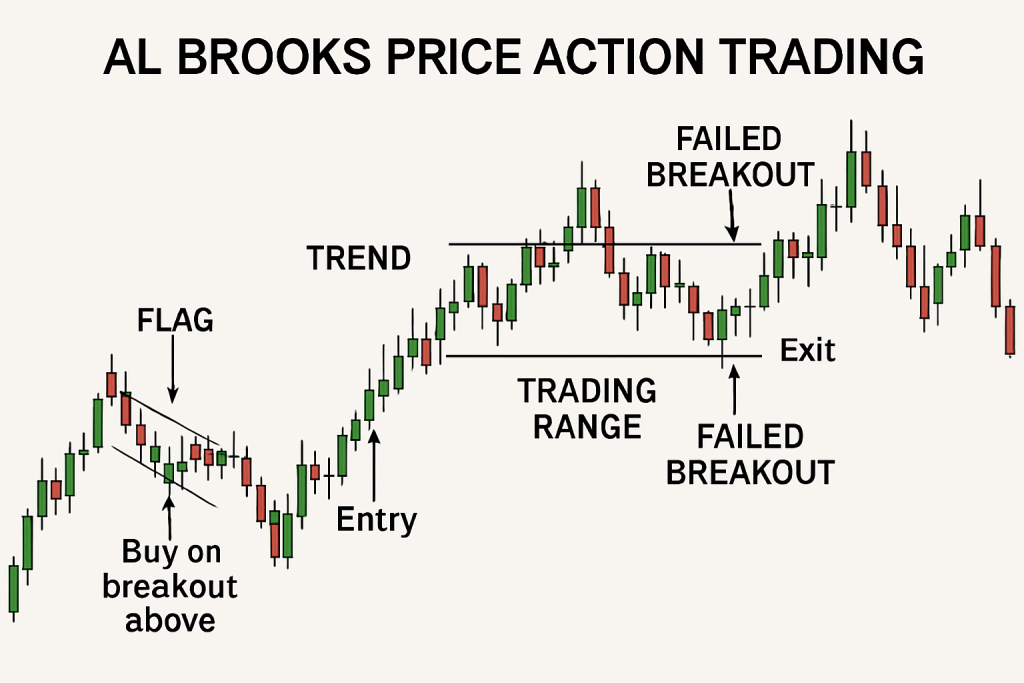
🚩 Flags (Continuation Patterns)
Flags are brief consolidations in a trend, often forming:
Rectangles
Small pullbacks
Pennants
They are continuation patterns. Brooks trades breakouts from flags, not into them.
Example:
After a strong bull move, a 3-bar tight sideways range = bull flag. Entry: buy breakout.
—
🔻 Ascending and Descending Wedges
Brooks calls them converging channels, not just wedge shapes.
Ascending Wedge (Bearish):
Higher highs but weakening
Shortening pushes
Potential reversal or breakout failure
Descending Wedge (Bullish):
Lower lows with declining momentum
Often leads to reversal up
Wedges require confirmation — don’t preemptively trade them.
—
🔺 Triangles and Rectangles
Both are forms of trading ranges.
Triangles: Price compresses. Expect breakout, but direction is uncertain.
Rectangles: Horizontal range. Trade at edges or after breakout.
Avoid the middle — wait for edge reaction or breakout.
—
📐 Channels
Channels are sloped trading ranges, defined by parallel trendlines.
Types:
Bull Channel: Buy pullbacks near bottom line
Bear Channel: Sell pullbacks near top line
Brooks teaches to always look for:
Breaks and reversals of channels
Overthrows (false breakouts)
—
🥊 Channel Duels (Two-Legged Pullbacks)
A duel happens when price attempts to reverse, fails, and tries again.
Two-legged pullback (2LP) is key:
First leg down, small bounce, second leg down
Often followed by trend resumption
Example:
In an uptrend, a two-legged pullback to support followed by a strong bull bar = buy setup.
—
🧱 Understanding Legs in Price Movement
A leg is a directional move composed of smaller swings.
Brooks encourages:
Labeling legs to count pushes
Watching for 2 or 3 pushes (common before reversal)
Example: 3 strong legs in a trend may exhaust the move. Watch for signs of reversal.
—
Up Next: Article 2 (Part 2/2)
In the next article, we’ll dive into more advanced Al Brooks topics:
Complex range conditions (FTR, big up M big down)
Multi-timeframe zones
Pullbacks, EMA reactions, magnets
Spike breakouts, microchannels
Reversal setups (MTR)
And finally: the 10 best Al Brooks setups.