
Smart Money Concepts & ICT Method: The Complete Guide (Beginner to Intermediate)
Introduction
The Smart Money Concept (SMC) and the ICT (Inner Circle Trader) methodology have redefined technical analysis by focusing on how institutions move the market. Unlike traditional indicators, SMC and ICT prioritize liquidity, market structure, and order flow. This article will walk you through essential concepts from beginner to intermediate levels, with practical examples and beginner-friendly explanations.
1. Market Efficiency Paradigm
This paradigm challenges the belief that markets move randomly. According to ICT, markets are not random—they are manipulated by institutions to reach zones where retail traders place stop-loss orders.
Example:
Imagine a bank wants to buy at a lower price. They might push the market down to where traders have stop-losses, grab that liquidity, then reverse price back up.
Key Lesson: Price moves are not chaotic—they are engineered to take out liquidity and fill institutional orders.
2. Liquidity
Liquidity refers to how easy it is to buy or sell something without affecting its price too much. In trading, it’s where orders are waiting.
Think of it like this:
When many traders put stop-losses below a recent low, it creates a pool of liquidity. Institutions target those areas because they need large volume to fill their own trades.
3. Types of Liquidity
a. External Liquidity
This exists outside of the current price range.
- Above highs = Buy-side liquidity
- Below lows = Sell-side liquidity
b. Internal Liquidity
Liquidity within a consolidation range.
- Formed by equal highs/lows
- Often used by smart money to manipulate entries
c. Engineered Liquidity
Artificially created by institutions.
- For example, making multiple equal highs to lure buyers before a sudden drop
4. Practicing Liquidity Zones
Go to a live chart (like EUR/USD) and:
- Mark all equal highs/lows
- Note previous session highs/lows
- Look for places where price sharply reversed—likely after taking out liquidity
Exercise Example: On a 1-hour chart, look for:
- Double tops (internal liquidity)
- Stops above a swing high (external liquidity)
- Price breaking high, then sharply dropping (liquidity grab)
5. Displacement
Displacement is a strong, sudden move in price caused by institutional orders. It usually follows a consolidation or accumulation phase.
What to Look For:
- Big candles in one direction
- Breaks previous highs/lows
- Leaves gaps (called Fair Value Gaps)
Why it Matters:
Displacement confirms institutional presence. It often marks the beginning of a trend.
6. Order Block – Part 1
An Order Block (OB) is the last candle before a strong move.
- In an uptrend: the last down candle before a big rally
- In a downtrend: the last up candle before a big drop
Purpose: It shows where institutions placed their orders. Price often returns to this candle before continuing the trend.
7. Order Block – Part 2
How to Use OBs:
- Identify a strong move (displacement)
- Find the last candle before that move
- Mark the high and low of that candle as your OB zone
Beginner Tip: OBs become strong if price returns to them and reacts without breaking through.
8. Validating Order Blocks
Not every OB is valid. Use this checklist:
- Was there displacement after the OB?
- Did price break market structure (BOS)?
- Is there a Fair Value Gap near the OB?
If yes to all = strong OB.
9–10. Optimizing Order Blocks
Sometimes OBs are too big. You can refine them by:
- Dropping to a lower time frame and identifying a smaller OB
- Aligning with FVG or Premium/Discount levels
Example:
If an OB on the 1H chart is large, go to the 15M and find a more precise OB within the same zone.
11. Breaker Block
A Breaker Block is a failed OB. It’s an OB that price broke through—but then, price comes back and uses it as support/resistance.
Use it as a signal for:
- Reversals
- Entry confirmation zones
12–13. Mitigation Block – Part 1 & 2
When price returns to an OB but doesn’t break it—instead it bounces—it’s called mitigation.
Institutions are:
- Closing out or “mitigating” leftover positions
Use mitigation zones for smart, low-risk entries.
14. Rejection Block
A rejection block is a zone where price tried to break out but quickly rejected.
Example:
- Price goes above a recent high (liquidity grab)
- Immediately drops back = rejection
15. Fair Value Gap (FVG)
This is an imbalance in the market where price moved too fast, leaving a gap between candles.
How to Spot It:
- Candle 1: high
- Candle 2: big candle
- Candle 3: low
If Candle 3’s low > Candle 1’s high → FVG exists between them
16–17. Premium, Discount & Equilibrium – Part 1 & 2
These help decide where price is too expensive (premium) or too cheap (discount).
How to Use:
- Draw a Fibonacci from swing low to swing high
- 50% line is the equilibrium
- Above = premium (ideal for selling)
- Below = discount (ideal for buying)
Use OBs and FVGs only in their correct zones.
18. PDAs Matrix
PDAs = Premium Discount Arrays
This matrix includes:
- OBs
- FVGs
- Liquidity levels
All aligned with the premium/discount zones.
Purpose: Helps stack confluences for high-probability trades.
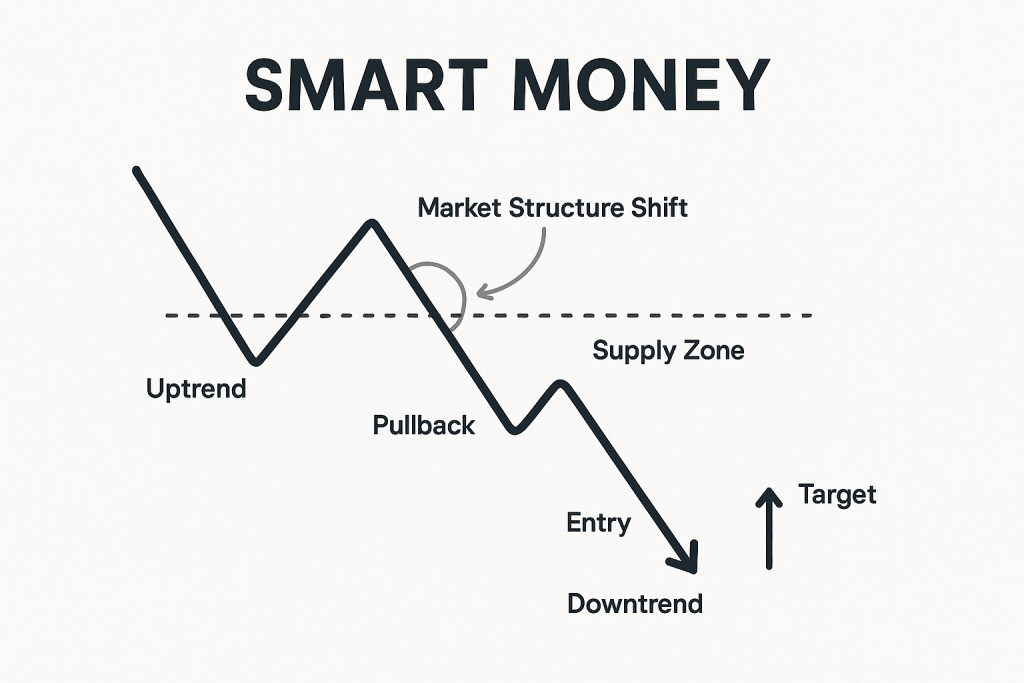
19–20. BMS & MSS – Part 1 & 2
BMS (Break of Market Structure):
Occurs when price breaks a key swing high/low. Signals a trend change.
MSS (Market Structure Shift):
A smaller, early signal of reversal before a big BOS happens.
Tip: MSS + OB + FVG = great entry confirmation
21. Chart Practice – Part 1
Open any chart (e.g., NAS100 or EUR/USD). Do the following:
- Identify an OB that caused displacement
- Mark nearby FVGs
- Find BOS or MSS
Practice spotting:
- Liquidity zones
- Entry confirmations
Conclusion
You’ve just learned the core mechanics of Smart Money Concepts. Now you can:
- Identify OBs, FVGs, BOS, MSS
- Understand liquidity’s role
- Use premium/discount zones
In the next article, we’ll explore advanced tools like institutional bias, time-of-day strategy, IPDA, Power of 3, and more real-case chart studies.
Next Up: [Advanced ICT Trading Strategies: Smart Money, Bias, IOF, and Beyond]