
Smart Money Concepts & ICT Method: The Complete Guide (Beginner to Intermediate)
Introduction
The Smart Money Concept (SMC) and the ICT (Inner Circle Trader) methodology have redefined technical analysis by focusing on how institutions move the market. Unlike traditional indicators, SMC and ICT prioritize liquidity, market structure, and order flow. This article will walk you through essential concepts from beginner to intermediate levels, with practical examples and explanations.
1. Market Efficiency Paradigm
The Market Efficiency Paradigm in ICT theory challenges the notion of randomness in price action. It proposes that price movements are purposeful and driven by institutions to accumulate or distribute positions.
Key Point: Markets are engineered to reach liquidity pools. If you understand this, you can anticipate where price is likely to go.
2. Liquidity
Liquidity refers to areas on the chart where stop-loss orders accumulate. These zones are targets for smart money.
Examples of liquidity:
- Buy-side liquidity: above recent highs
- Sell-side liquidity: below recent lows
3. Types of Liquidity
a. External Liquidity
- Found outside of a trading range (e.g., above swing highs or below swing lows)
b. Internal Liquidity
- Found inside a range, created by equal highs/lows or minor consolidations
c. Engineered Liquidity
- Created by smart money to trap retail traders before a reversal
4. Practicing Liquidity Zones
To identify liquidity zones:
- Look for equal highs/lows (internal liquidity)
- Identify previous session highs/lows (external liquidity)
- Observe false breakouts (engineered liquidity)
Exercise: Go to a 1-hour chart and mark:
- Daily highs/lows
- Double tops and bottoms
- Recent liquidity grabs
5. Displacement
Displacement is a strong impulsive move away from a consolidation, indicating institutional involvement.
Characteristics:
- Long candles with minimal wicks
- Breaks previous structure
- Leaves behind Fair Value Gaps (FVGs)
6–10. Order Blocks (OB)
Order Block – Part 1 & 2
Order Blocks are the last bullish or bearish candles before an impulsive move.
Bullish OB: Last down candle before a sharp move up
Bearish OB: Last up candle before a sharp move down
Validating Order Blocks
- Must break structure (BOS)
- Should displace liquidity
- Accompanied by an FVG
Refining Order Blocks
- Use lower timeframes to refine entry
- Align with premium/discount zones (see later)
Example:
If price rallies after a bearish candle and breaks resistance, that candle is likely a bullish OB.
11. Breaker Block
A Breaker Block is a failed OB. When price returns to it later, it acts as support or resistance.
Use Case:
- Price breaks below bullish OB but then uses it as resistance
12–13. Mitigation Block – Part 1 & 2
Mitigation Blocks are OBs that get revisited to fill unmitigated orders.
Use Case:
- Entry area during pullbacks
14. Rejection Block
Occurs when price attempts to move higher or lower but quickly rejects from a key level (often OB or FVG).
15. Fair Value Gap (FVG)
An FVG is an imbalance between buy and sell orders. Visually, it’s a gap between candles.
Example: In a bullish move:
- Candle 1: Low = 1.2000
- Candle 2: High = 1.2100
- Candle 3: Opens at 1.2200
=> FVG between 1.2100 and 1.2200
16–17. Premium, Discount & Equilibrium – Part 1 & 2
Premium Zone:
- Price is above the 50% equilibrium
- Look for sell setups (in downtrends)
Discount Zone:
- Price is below the 50% level
- Look for buy setups (in uptrends)
Use the Fibonacci tool to identify 50% level.
18. PDAs Matrix (Premium-Discount Arrays)
Combines OBs, FVGs, and liquidity zones within premium/discount regions for optimal trade zones.
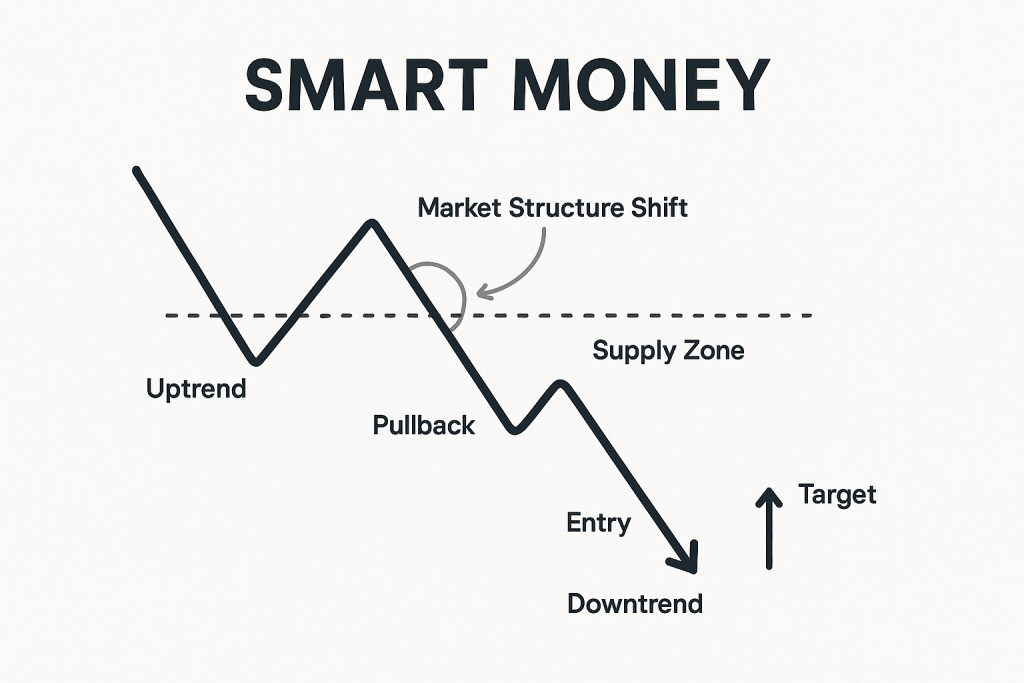
19–20. BMS & MSS – Part 1 & 2
BMS (Break of Market Structure):
- Price breaks a swing high/low = trend shift
MSS (Market Structure Shift):
- Subtle internal shift before BMS, signals reversal
21. Chart Practice – Part 1
Go to EUR/USD or NAS100 and do the following:
- Identify OBs with displacement
- Mark liquidity levels
- Practice entries using FVG + OB + BMS alignment
Conclusion
Understanding smart money concepts like liquidity, order blocks, and structure shifts equips you with the tools to trade like institutions. In the next article, we’ll dive deeper into bias, IOF, time and price alignment, and advanced models like Power of 3.
Next Up: [Advanced ICT Trading Strategies: Smart Money, Bias, IOF, and Beyond]