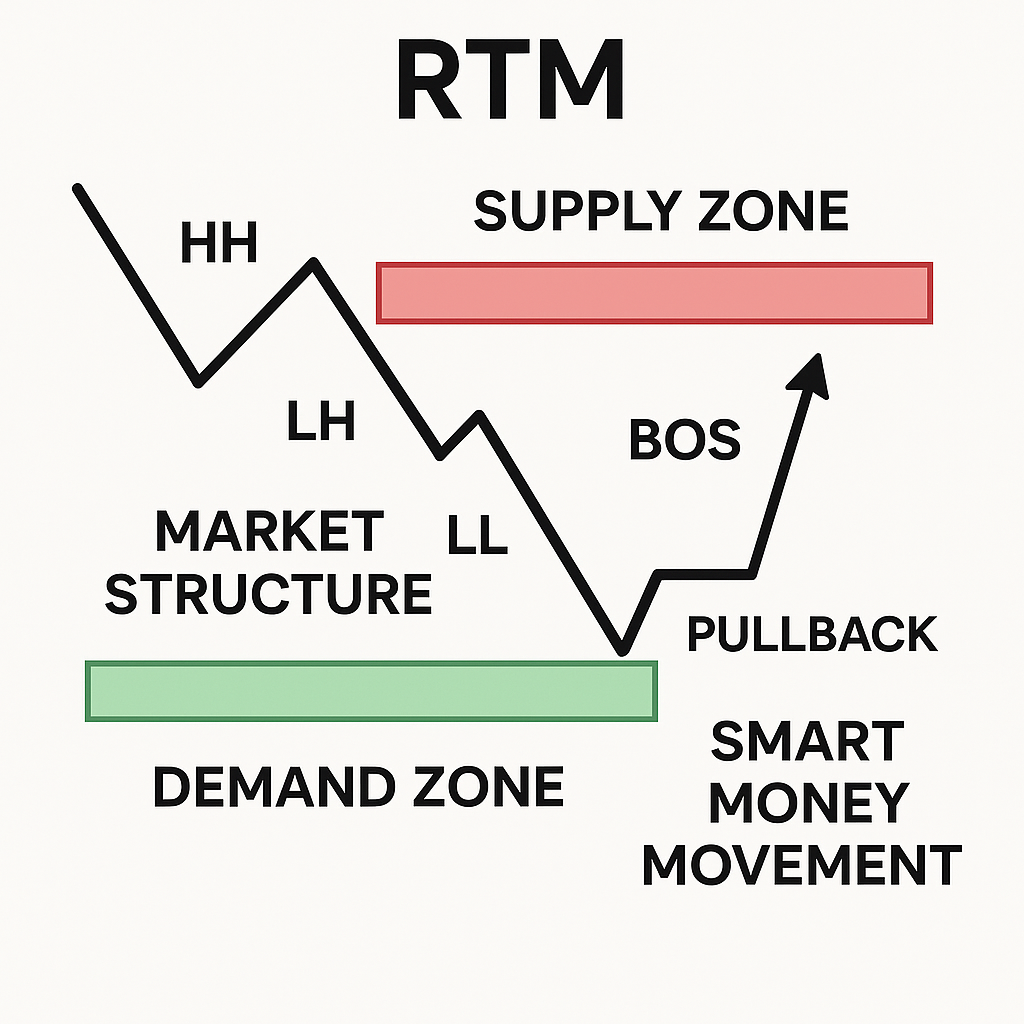
📘 Supply and Demand Method – Part 2
Advanced Concepts: How to Master Supply and Demand with Precision
—
🔹 8. Characteristics of a Good Base
A high-quality base significantly increases the chances of price reacting to it on a return. Here’s what makes a base strong:
1. Clean Structure: Few wicks, tight range.
2. Sharp Departure: Strong bullish/bearish candle right after base.
3. Volume Spike (optional): If available, high volume at departure confirms institutional activity.
4. Engulfing Previous Candle(s): Shows dominance of one side.
5. Origin of Move: It started a major trend or broke structure.
Example:
On USD/JPY H1, if you see a 3-candle consolidation followed by a large bearish engulfing candle that breaks recent lows—this is a good supply base.
—
🔹 9. How Good Bases Look on a Chart
Let’s define what visually good supply and demand bases look like:
For Supply (RBD, DBD):
Small-bodied candles or dojis at top.
Big red candle following base.
Often occurs after a fake breakout of highs.
For Demand (DBR, RBR):
Dojis or small candles at bottom.
Strong green candle at departure.
Often at end of a bear trend or after a stop-hunt.
Visual Example:
EUR/USD forms a small base at 1.0980 → then a massive 100-pip drop. That’s a textbook RBD.
—
🔹 10. Curve & Context: Understanding the Big Picture
The curve is a visual representation of where price is within a larger zone. It helps us identify if price is near:
Extreme Supply → look for short
Extreme Demand → look for long
Middle (No Man’s Land) → avoid
How to use the curve:
1. Draw the higher timeframe zone (D1 or H4).
2. Divide it into thirds: Top, Middle, Bottom.
3. Trade only at extremes with confirmation.
Example:
GBP/USD D1 demand zone spans from 1.2000–1.2100. If price is at 1.2020 (bottom third), you look for longs. If it’s at 1.2075 (middle), avoid entry.
—
🔹 11. Zone Validation & Scoring System
Use a zone checklist or scoring model to filter trades.
Criteria Points
Strong departure +2
Fresh zone (first touch) +2
Engulfed opposite candle +1
Located at curve extreme +2
Within HTF demand/supply zone +1
Clean base (2–4 candles) +1
Total:
6–8 points = Strong
3–5 points = Medium
<3 = Skip
—
🔹 12. Flip Zones: When Demand Becomes Supply
A Flip Zone is where a former demand zone breaks and becomes new supply (and vice versa).
Why this matters:
These zones are excellent entries with high R:R.
Example:
Price bounces from demand at 1.1200 → rallies to 1.1300
Then drops below 1.1200 (breaking the zone)
On retest of 1.1200 → Sell opportunity (now it’s supply)
—
🔹 13. Engulf Pattern (and How to Trade It)
Engulfing = A candle that fully covers the body of the previous candle.
Pattern Meaning Entry
Bullish Engulf Buyers overpower sellers Look for demand zone below
Bearish Engulf Sellers dominate buyers Look for supply zone above
Trade Strategy:
Find engulfing candle from base
Mark origin of engulf → this is new demand/supply
Trade first retest of that zone
Example:
AUD/JPY forms a 2-candle bullish engulf on M30 after a DBR base → strong signal for long.
—
🔹 14. FTR (Failure to Return)
FTR = Failure To Return
This pattern shows that price wanted to retest a level but failed—a sign of strong momentum in opposite direction.
What it tells you:
Unfilled orders remain
Sharp directional bias
Price avoids zone on purpose
Use case:
Mark FTR zones as targets
Use them for trend continuation
—
🔹 15. Golden Zones in Supply and Demand
“Golden Zones” are areas with the highest probability of reversal or continuation, such as:
At the extreme end of a curve
Near HTF order block
After a false breakout
Just above/below round numbers
Why they work: They often contain clustered institutional orders.
Example:
On USD/CAD, price forms demand at 1.3500 after a fakeout below 1.3480—textbook Golden Demand Zone.
—
✅ Summary of Part 2
Concept Key Insight
Good Base Strong departure, clean candles, 2–4 base bars
Curve Position Trade extremes, not middle
Zone Scoring Use checklist to evaluate zones
Flip Zones Broken demand → supply, great R:R
Engulf Pattern Confirms strength and imbalance
FTR Indicates urgency and power
Golden Zones High confluence reversal areas
—
❓ FAQs – Part 2
Q: Should I enter immediately on zone touch?
A: No. Always wait for a confirmation pattern like engulf, pin bar, or FTR before entering.
Q: Can Flip Zones be traded both ways?
A: Yes—but only if they break clearly and price respects the flip.
Q: What’s the best timeframe to identify Flip or FTR?
A: M15–H1 for precision; H4–D1 for context.


