
📘 Supply and Demand Method – Part 1
From Beginner to Pro: Understanding the Foundations of Supply and Demand Trading
—
🔹 1. Introduction to the Supply and Demand Method
In financial markets, price is driven by the constant battle between supply (sellers) and demand (buyers). The Supply and Demand Method (RTM-style) aims to identify areas on the chart where institutional buyers and sellers are most active—allowing retail traders to “follow the smart money.”
This method is based on locating imbalances—zones where price moved rapidly due to high buying or selling pressure. By identifying these areas, traders can anticipate potential reversals or strong continuations.
—
🔹 2. What is a Base and How to Draw It?
Definition of Base:
A base is the consolidation area that forms between a strong rally (R) or drop (D). It’s where price pauses before moving impulsively in one direction. Bases are the foundation of supply or demand zones.
Types of structures that create a base:
Rally-Base-Drop (RBD): Supply Zone
Drop-Base-Rally (DBR): Demand Zone
Rally-Base-Rally (RBR): Continuation of demand
Drop-Base-Drop (DBD): Continuation of supply
How to draw a base:
1. Identify a strong impulsive move (a rally or drop).
2. Look for the last consolidation area (2–6 candles max).
3. Mark the high and low of that range → this becomes your base zone.
4. Extend the zone rightward for future reference.
Example:
On the EUR/USD H4 chart, if you see price dropping rapidly after a small 3-candle consolidation, that small consolidation area is your supply base (RBD).
—
🔹 3. Drawing Supply and Demand Zones
Once the base is drawn, we define the supply/demand zone by:
Marking the high/low of the base candles.
Extending that rectangle forward.
Noting how price returns to the zone later.
Example:
If price rallies sharply from a 4-candle base, then retraces weeks later into that same base area and drops again → this confirms a valid demand zone.
—
🔹 4. Common Patterns in Supply and Demand
Understanding price behavior around zones helps anticipate future price action.
Pattern Description Interpretation
RBD Rally → Base → Drop Institutional sell zone
DBR Drop → Base → Rally Institutional buy zone
RBR Rally → Base → Rally Demand continuation
DBD Drop → Base → Drop Supply continuation
Example:
On a GBP/JPY daily chart, a DBD zone that causes a 500-pip drop is a very strong institutional supply.
—
🔹 5. Validating Supply and Demand Zones
Not all zones are equal. To filter high-probability zones:
1. Strong departure from the base: Was it a big candle? Did it engulf previous candles?
2. Few base candles: 2–4 base candles are ideal.
3. Fresh zone: Has price returned to this zone before?
4. Located at key turning points: E.g., swing highs/lows or at the origin of trend changes.
Example:
A zone on USD/CHF that caused an engulfing of the last 3 candles and never saw a retest until weeks later is a strong candidate.
—
🔹 6. Peaks and Valleys (Highs and Lows)
Understanding market structure is vital.
Valleys (troughs) = Potential demand
Peaks (crests) = Potential supply
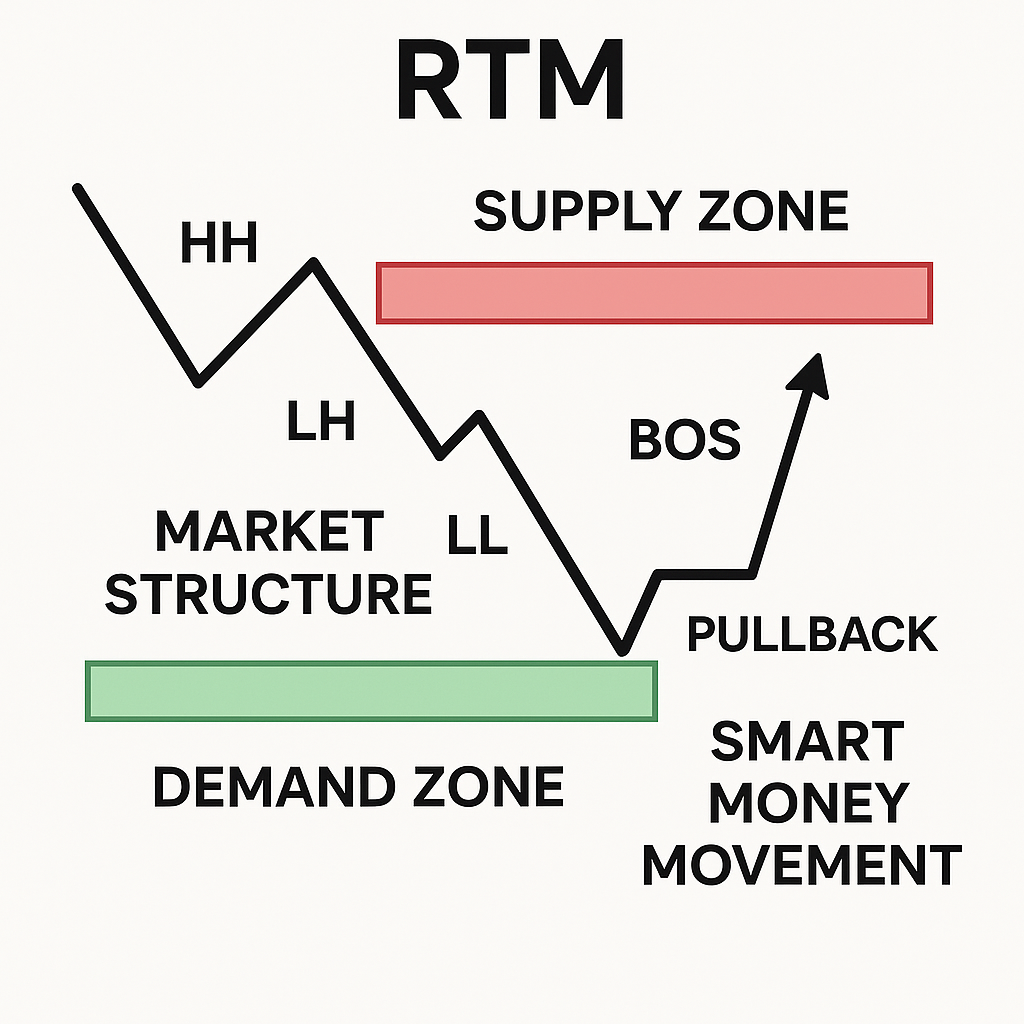
By identifying higher highs (HH) and higher lows (HL) or lower highs (LH) and lower lows (LL), traders determine:
Market direction (bullish or bearish)
Where demand/supply likely sits
Example:
In an uptrend (HH and HL), look for demand zones in valleys. In a downtrend (LL and LH), seek supply zones at peaks.
—
🔹 7. Continuation Patterns & Fresh Zones
Fresh zones are those that haven’t been retested yet. Continuation patterns often emerge from them.
Why fresh zones matter:
They have untouched orders.
First retests are most powerful.
Continuation setups:
RBR (bullish continuation)
DBD (bearish continuation)
Example:
AUD/USD forms an RBR zone that leads to a 3-leg rally. The first retest of the base offers a high-probability long.
—
✅ Summary of Part 1
Topic Key Takeaway
Supply/Demand Concept Price moves due to institutional imbalances
Base Structure 2–6 candles between impulsive moves
Drawing Zones Identify base, extend zone
Patterns (RBD, DBR…) Reveal institutional footprint
Peaks/Valleys Identify strong turning points
Fresh Zones & Continuation First touch is most powerful
—
❓ FAQs – Part 1
Q: How many base candles are acceptable?
A: Ideally between 2 to 6. More than that reduces strength.
Q: Can I use indicators with this method?
A: This is a price-action-based approach. You can combine it with RSI or Volume for confluence, but it’s not required.
Q: Which timeframes work best?
A: H4 and D1 are best for swing trades; M15 and M5 for scalping (with confirmation).