
📘 The Complete Guide to Wyckoff Theory: Decode the Market Like a Pro
Understand how smart money moves, identify market phases, and apply professional strategies using the Wyckoff Method.
Introduction
Financial markets may seem chaotic, but behind every price movement lies a hidden pattern—driven by supply, demand, and the behavior of big players. The Wyckoff Method helps us uncover that pattern and trade like the professionals.
In this comprehensive guide, you’ll learn everything you need to know about Wyckoff Theory—from foundational principles to practical chart analysis and real-world trading setups.
Section 1: What Is the Wyckoff Method?
The Wyckoff Method was developed in the early 1900s by Richard D. Wyckoff, a pioneer in technical analysis. He studied how large institutional investors—known today as “smart money”—operate. His goal was to help retail traders spot the footprints of these big players and profit by following them.
Section 2: The Three Laws of Wyckoff
🔹 1. The Law of Supply and Demand
Price moves based on the relationship between supply and demand:
- Demand > Supply → Price rises
- Supply > Demand → Price falls
🔹 2. The Law of Cause and Effect
Every large price move (effect) stems from a prior accumulation/distribution phase (cause).
🔹 3. The Law of Effort vs. Result
Compares volume (effort) to price action (result):
- High volume + small move = weakness
- Low volume + strong move = hidden strength
Section 3: Wyckoff Market Structure
Markets move in two key phases:
- Accumulation: Smart money buys quietly at low prices
- Distribution: Smart money sells at high prices
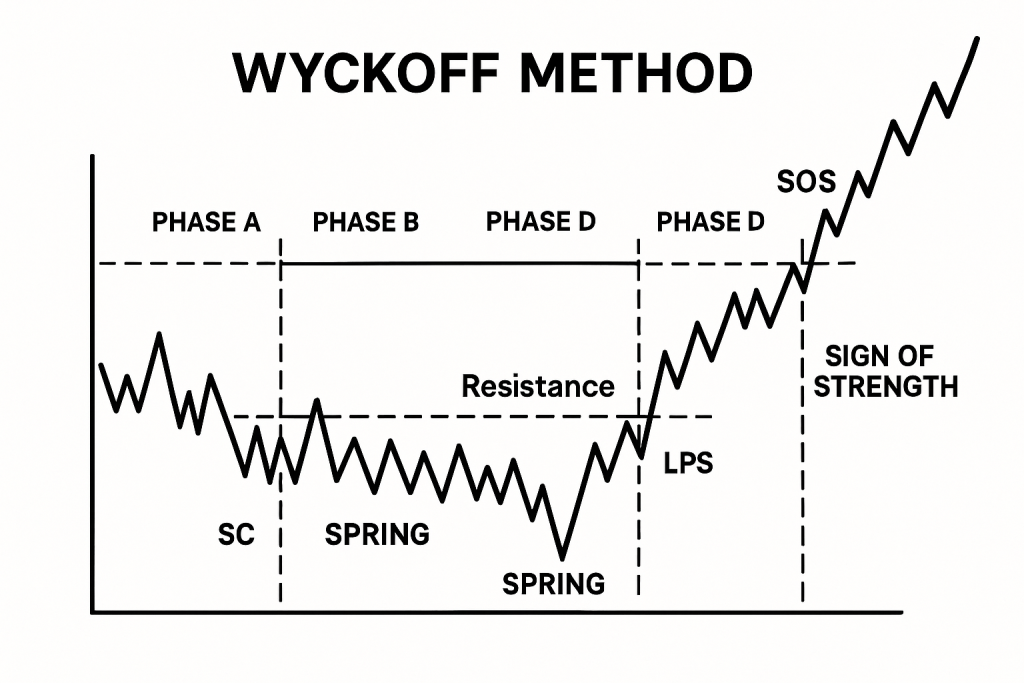
Section 4: Accumulation & Distribution Phases
🟢 Accumulation
| Label | Description |
|---|---|
| SC | Selling Climax – Sharp drop with high volume |
| AR | Automatic Rally – Fast recovery |
| ST | Secondary Test – Retest of SC with less volume |
| LPS | Last Point of Support – Higher lows with declining volume |
| SOS | Sign of Strength – Breakout with volume |
🔴 Distribution
| Label | Description |
|---|---|
| BC | Buying Climax – Sharp rise with volume |
| AR | Automatic Reaction – First pullback |
| ST | Secondary Test – Test of highs with weak volume |
| UT | Upthrust – False breakout above resistance |
| SOW | Sign of Weakness – Breakdown on volume |
| LPSY | Last Point of Supply – Weak rally before collapse |
Section 5: The 5-Step Wyckoff Strategy
- Identify Market Phase
- Determine the Cause
- Estimate the Effect
- Select Strong Asset
- Wait for Confirmation
Section 6: Entry/Short Strategy Examples
✅ Entry Strategy
- Enter on SOS above AR
- Stop-loss under LPS
- Target 1: $21,500 | Target 2: $25,000
❌ Short Strategy
- Enter below SOW
- Stop above UT
- Target 1: $3,500 | Target 2: $2,800
Section 7: Real Chart Analysis (Step-by-Step)
- Zoom Out
- Check Volume
- Compare Reactions
- Label Phases
- Wait for Confirmations
Section 8: Common Traps
- Mislabeling Phases
- Ignoring Volume
- No Confirmation = Risky Trades
Section 9: Practice Exercises
- Exercise 1: Identify SC or UT in any chart
- Exercise 2: Find both an accumulation & distribution chart
Section 10: Wyckoff + Price Action
| Candlestick | Wyckoff Context |
|---|---|
| Hammer | LPS |
| Bearish Engulfing | UT or SOW |
| Doji (high volume) | Uncertainty |
| Bullish Marubozu | SOS |
Final Thoughts
The Wyckoff Method offers a professional edge by aligning with the actions of smart money. With practice, you’ll learn to trade with clarity and confidence using this powerful approach.